|
Success!
Todd R. Kincaid, PhD
Overview
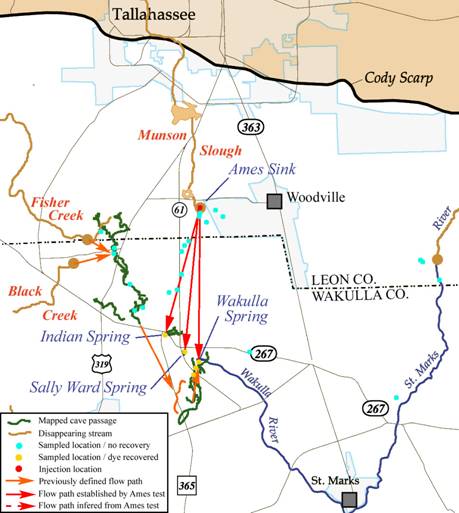
A rapid connection between Ames Sink and Indian, Sally Ward, and
Wakulla Spring has been confirmed. The destination and travel-time
of water entering Ames sink have long been contentious issues
because the sink receives a large part of the surface water runoff
from the city of Tallahassee. This tracing experiment has shown
that the runoff water is flowing to the springs.
We began the Ames Sink test on August
11, just before Tropical Storm Bonnie unloaded its rain on the WKP.
The tracer was injected into the stream flow at 7:55 PM. The stream
stage was approximately .09 m (~0.3 ft). By 10:00 AM the next
morning, the dye had flowed into the ground and the stage height
had risen to greater than 1.83 m (~6.0 ft) due to the rain.
Sampling had already begun at more than 10 points in the basin and
by the end of the day we were continuously sampling 24 locations.
Ten days later the tracer was detected at Indian spring. Within
another 10 days it was also recorded at Sally Ward and Wakulla
springs. Individual dye hits were also detected at B-tunnel and
K-tunnel.
Injection
The goal of all our tracing experiments is to use as little dye as
possible to achieve a detectable break-through curve at the
sampling locations, where the amount of dye required is determined
by the distance of the flow path, flow rate, rate of injection, and
the background fluorescence. Minimizing the amount of dye reduces
cost, potential impacts to local water wells, and residual levels
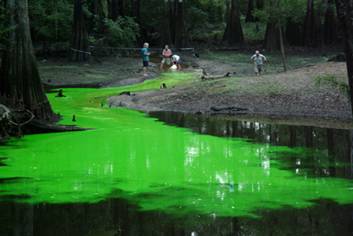
of dye in the aquifer. Seven and one half kilograms (~16.5 lbs) of
liquid uranine dye (C.I. Acid Yellow 73) were poured into the
stream flow immediately above Ames Sink at 7:35 PM on August 11,
2004. The dye flowed rapidly into the sink and disappeared into the
ground within 12 hours as the stream stage rose 2 meters ( ~6 ft)
from rainfall associated with Tropical Storm Bonnie.
Sampling
The Ames Sink test was the most ambitious trace we have attempted.
The minimum distance between the injection point and the nearest
probable receptor (Leon sinks Cave System at Big Dismal Sink) is
5.1 km (~3.2 miles), which is approximately twice as far as the
pathways traced at Fisher Creek and Black Creek. The major springs,
Wakulla, Indian, Sally Ward, McBride's, and the St. Marks River
Rise are 9.3, 8.1, 8.7, 9.2, and 15.13 km (5.8, 5.0, 5.4, 5.7 and
9.4 miles) away, respectively. 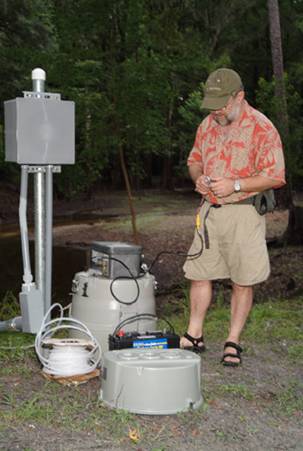
Automated water samplers were setup to
collect samples at between 1 and 6 hour intervals at 12 locations:
Abysmal, Susan, Force, Sullivan, Cheryl, Emerald, Upper River,
Turner, and Ferrell-Turner sinks; K-Tunnel and the spring vent in
Wakulla cave; and the St. Marks River rise. Grab samples were
collected between 2 and 3 times per day, with the help of our
project volunteers, at an additional 9 locations: Rectangle,
Horse Lot, Ferrell-Road, and Meeting House sinks; and Indian, Sally
Ward, McBride's, Newport, and Rhodes springs. Sampling began on
August 11 and continued through August 16 for the sinkholes closest
to Ames and August 30 for the remaining locations setup with
autosamplers. Grab sampling was continued at the springs through
September 9.
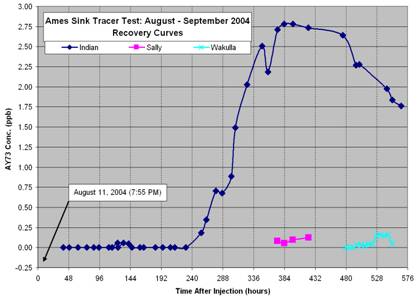
Recovery
The first indication of the tracer appeared at K-Tunnel, but only
in one grab sample. Shortly thereafter, approximately 10 days after
the injection, the strongest signal from the tracer was recorded at
Indian Spring. A total of nineteen samples on a well defined
break-through curve were recorded at Indian over the ensuing 13
days with a peak concentration of approximately 2.8 ppb. The
beginnings of two additional break-through curves were recorded at
Sally Ward spring beginning at approximately 15 days after the
injection and at Wakulla spring beginning at approximately 20 days
after the injection.
Discussion
The tracer recoveries at each of the four locations is supported by
analyses performed on a scanning spectrofluorophotometer wherein
the synchronously-scanned emission spectrum for C.I.A.Y. 73 was
observed and measured for each of the samples on the respective
recovery curves. We are therefore confident in the designation of
flow paths between Ames Sink and the three springs. The exact
pathways and transit velocities, however, cannot be confidently
calculated because complete recovery curves were not obtained and
the tracer was not observed in any of the intermediate sinkholes
between Ames Sink and the springs. One of the possible pathways
lies between Ames Sink and some point in the downstream section of
the Leon Sinks cave system that was shown previously to connect to
K-Tunnel south of Turner sink.
The intermediate sinkhole data, or lack
thereof, are largely unreliable because none of the sinkholes other
than those intersecting the Leon Sinks cave system were properly
instrumented with tubing leading to observably flowing water.
Persistent high flow conditions in the basin kept visibility below
the level deemed necessary to conduct safe diving operations by the
Woodville Karst Plain Project divers during the months prior to the
test. The high flow conditions through the basin resulting from the
large rainfall events immediately after the injection likely
contributed to significantly more tracer dilution than we had
anticipated and potentially the activation of additional flow
paths. These three factors could have led to both the lack of
tracer recovery in the intermediate sinkholes as well as the low
and variably detectable concentrations at Sally Ward and the
Wakulla spring vent.
Another complicating factor only became
apparent toward the end of the sampling period, when discussions
with a property owner that had provided access for sampling led us
to a sinkhole approximately 700 m (~2100 ft) further downstream of
Ames sink. This sink was receiving overflow water from Ames and
funneling it into an observable limestone outcrop into the aquifer.
Flow measurements revealed that the newly identified feature
("Spider Sink") recharges at least 10 times more flow into the
aquifer than Ames Sink, at a rate of 1.8 cubic meters per second
(~62.5 cubic feet per second). The existence of "Spider Sink"
further increases the likelihood that the tracer was significantly
diluted shortly after injection and would produce
lower-concentration, broader break-through curves such as the ones
the were partially recorded at Indian, Sally Ward and Wakulla
springs.
Conclusions
We've conducted five successful quantitative tracer tests in the
Woodville Karst Plain: Sullivan Sink - Cheryl Sink, Fisher Creek -
Emerald Sink, Black Creek - Emerald Sink - Wakulla Spring, Emerald
Sink - Wakulla Spring, and now Ames Sink - Indian, Sally Ward, and
Wakulla springs. Each of these traces has demonstrated rapid
connections between the disappearing streams in the basin and the
major springs, thereby broadening our understanding of the extent
of the springsheds that directly influence spring water quality.
The most important conclusion from this work is that the karst
features (caves) provide the controlling influence on flow paths
and velocities in the Woodville Karst Plain and that these features
provide similar controls on flow patterns in other karst basins in
Florida. It is crucial, therefore, that we adequately delineate
these features and address their influence on groundwater and
surface water flow patterns if we are to effectively manage and
protect our groundwater resources. In our next phase of work we
will endeavor to reproduce the Ames Sink results and obtain
complete break-through curves such that the key hydraulic
parameters along the respective flow paths can be established;
expand our studies to include the Spring Creek springs; and use the
amassed data to develop a model of groundwater flow through the
Woodville Karst Plain that both accurately embraces the karst flow
patterns and provides a predictive tool for improved water resource
management in the basin.
Acknowledgements
This project was funded by the Florida Geological Survey
Hydrogeology Program and the Florida Springs Initiative. Dr.
Rodney DeHan and Dr. David Loper of the Florida Geological Survey
(FGS) and the Florida State University Geophysical Fluid Dynamics
Institute (GFDI), respectively, have continued to work diligently
as the project directors to support this research. The Northwest
Florida Water Management District and the Florida Department of
Environmental Protection provided the autosamplers that were
crucial to the success of the project. Wakulla Springs State Park
provided logistical support and lodging for our team members. The
Global Underwater Explorers - Woodville Karst Plain Project
provided professional highly-skilled cave divers that instrumented
the springs and sinkholes with tubing, which was critical to
effective sampling and without which our successes thus far would
have been highly suspect. Gareth Davies of Cambrian Ground Water
Co. is one of the world's foremost experts in quantitative
groundwater tracing and has skillfully directed all of our
injection and sampling protocols. James McClean of the FGS, Brent
Meyer of Hazlett-Kincaid, Inc, and Chris Werner of GFDI were the
technical staff that ensured that the sampling equipment stayed up
and running throughout the duration of the test. Cal Jamison, the
Springs Ambassador for the Woodville Karst Plain, patiently led us
to numerous sinkholes throughout the basin and helped negotiate
access for sampling. Linda Jamison, Ed Chelette, and Paul Johnson
volunteered to collect grab samples throughout the month-long test.
All of these individuals and organizations as well as many more
that I haven't mentioned, for the sake of brevity, including the
numerous property owners that graciously allowed us access to the
sinkholes at all hours of the day and night, were invaluable to the
success of this project. Our sincere thanks go out to everyone that
has helped make this project a success.
|
Study made possible through the support of:


|